1 - Grafana
This page describes how to configure Grafana for Kiali.
Grafana configuration
Istio provides preconfigured Grafana
dashboards for the
most relevant metrics of the mesh. Although Kiali offers similar views in its
metrics dashboards, it is not in Kiali’s goals to provide the advanced querying
options, nor the highly customizable settings, that are available in Grafana.
Thus, it is recommended that you use Grafana if you need those advanced
options.
Kiali can provide a direct link from its metric dashboards to the equivalent or
most similar Grafana dashboard, which is convenient if you need the powerful
Grafana options. For these links to appear in Kiali you need to manually
configure the Grafana URL and the dashboards that come preconfigured with Istio, like in the following example:
Kiali will query Grafana and try to fetch the configured dashboards. For this reason Kiali must be able to reach Grafana, authenticate, and find the Istio dashboards. The Istio dashboards must be installed in Grafana for the links to appear in Kiali.
spec:
  external_services:
    grafana:
      enabled: true
      # Grafana service name is "grafana" and is in the "telemetry" namespace.
      in_cluster_url: 'http://grafana.telemetry:3000/'
      # Public facing URL of Grafana
      url: 'http://my-ingress-host/grafana'
      dashboards:
      - name: "Istio Service Dashboard"
        variables:
          namespace: "var-namespace"
          service: "var-service"
      - name: "Istio Workload Dashboard"
        variables:
          namespace: "var-namespace"
          workload: "var-workload"
      - name: "Istio Mesh Dashboard"
      - name: "Istio Control Plane Dashboard"
      - name: "Istio Performance Dashboard"
      - name: "Istio Wasm Extension Dashboard"
The described configuration is done in the Kiali CR when Kiali is installed using the Kiali Operator. If Kiali is installed with the Helm chart then the correct way to configure this is via regular –set flags.
2 - Prometheus
This page describes how to configure Prometheus for Kiali.
Prometheus configuration
Kiali requires Prometheus to generate the
topology graph,
show metrics,
calculate health and
for several other features. If Prometheus is missing or Kiali
can’t reach it, Kiali won’t work properly.
By default, Kiali assumes that Prometheus is available at the URL of the form
http://prometheus.<istio_namespace_name>:9090, which is the usual case if you
are using the Prometheus Istio
add-on.
If your Prometheus instance has a different service name or is installed in a
different namespace, you must manually provide the endpoint where it is
available, like in the following example:
spec:
  external_services:
    prometheus:
      # Prometheus service name is "metrics" and is in the "telemetry" namespace
      url: "http://metrics.telemetry:9090/"
Notice that you don’t need to expose Prometheus outside the cluster. It is
enough to provide the Kubernetes internal service URL.
Kiali maintains an internal cache of some Prometheus queries to improve
performance (mainly, the queries to calculate Health indicators). It
would be very rare to see data delays, but should you notice any delays you may
tune caching parameters to values that work better for your environment.
See the Kiali CR reference page for the current default values.
Compatibility with Prometheus-like servers
Although Kiali assumes a Prometheus server and is tested against it, there are
TSDBs that can be used as a Prometheus
replacement despite not implementing the full Prometheus API.
Community users have faced two issues when using Prometheus-like TSDBs:
- Kiali may report that the TSDB is unreachable, and/or
- Kiali may show empty metrics if the TSBD does not implement the
/api/v1/status/config.
To fix these issues, you may need to provide a custom health check endpoint for
the TSDB and/or manually provide the configurations that Kiali reads from the
/api/v1/status/config API endpoint:
spec:
  external_services:
    prometheus:
      # Fix the "Unreachable" metrics server warning.
      health_check_url: "http://custom-tsdb-health-check-url"
      # Fix for the empty metrics dashboards
      thanos_proxy:
        enabled: true
        retention_period: "7d"
        scrape_interval: "30s"
Prometheus Tuning
Production environments should not be using the Istio Prometheus add-on, or carrying over its configuration settings. That is useful only for small, or demo installations. Instead, Prometheus should have been installed in a production-oriented way, following the Prometheus documentation.
This section is primarily for users where Prometheus is being used specifically for Kiali, and possible optimizations that can be made knowing that Kiali does not utilize all of the default Istio and Envoy telemetry.
Metric Thinning
Istio and Envoy generate a large amount of telemetry for analysis and troubleshooting. This can result in significant resources being required to ingest and store the telemetry, and to support queries into the data. If you use the telemetry specifically to support Kiali, it is possible to drop unnecessary metrics and unnecessary labels on required metrics. This FAQ Entry displays the metrics and attributes required for Kiali to operate.
To reduce the default telemetry to only what is needed by Kiali users can add the following snippet to their Prometheus configuration. Because things can change with different versions, it is recommended to ensure you use the correct version of this documentation based on your Kiali/Istio version.
The metric_relabel_configs: attribute should be added under each job name defined to scrape Istio or Envoy metrics. Below we show it under the kubernetes-pods job, but you should adapt as needed. Be careful of indentation.
    - job_name: kubernetes-pods
      metric_relabel_configs:
      - action: drop
        source_labels: [__name__]
        regex: istio_agent_.*|istiod_.*|istio_build|citadel_.*|galley_.*|pilot_[^p].*|envoy_cluster_[^u].*|envoy_cluster_update.*|envoy_listener_[^dh].*|envoy_server_[^mu].*|envoy_wasm_.*
      - action: labeldrop
        regex: chart|destination_app|destination_version|heritage|.*operator.*|istio.*|release|security_istio_io_.*|service_istio_io_.*|sidecar_istio_io_inject|source_app|source_version
Applying this configuration should reduce the number of stored metrics by about 20%, as well as reducing the number of attributes stored on many remaining metrics.
Metric Thinning with Crippling
The section above drops metrics unused by Kiali. As such, making those configuration changes should not negatively impact Kiali behavior in any way. But some very heavy metrics remain. These metrics can also be dropped, but their removal will impact the behavior of Kiali. This may be OK if you don’t use the affected features of Kiali, or if you are willing to sacrifice the feature for the associated metric savings. In particular, these are “Histogram” metrics. Istio is planning to make some improvements to help users better configure these metrics, but as of this writing they are still defined with fairly inefficient default “buckets”, making the number of associated time-series quite large, and the overhead of maintaining and querying the metrics, intensive. Each histogram actually is comprised of 3 stored metrics. For example, a histogram named xxx would result in the following metrics stored into Prometheus:
xxx_bucket
- The most intensive metric, and is required to calculate percentile values.
xxx_count
- Required to calculate ‘avg’ values.
xxx_sum
- Required to calculate rates over time, and for ‘avg’ values.
When considering whether to thin the Histogram metrics, one of the following three approaches is recommended:
- If the relevant Kiali reporting is needed, keep the histogram as-is.
- If the relevant Kiali reporting is not needed, or not worth the additional metric overhead, drop the entire histogram.
- If the metric chart percentiles are not required, drop only the xxx_bucket metric. This removes the majority of the histogram overhead while keeping rate and average (non-percentile) values in Kiali.
These are the relevant Histogram metrics:
istio_request_bytes
This metric is used to produce the Request Size chart on the metric tabs. It also supports Request Throughput edge labels on the graph.
- Appending
|istio_request_bytes_.* to the drop regex above would drop all associated metrics and would prevent any request size/throughput reporting in Kiali.
- Appending
|istio_request_bytes_bucket to the drop regex above, would prevent any request size percentile reporting in the Kiali metric charts.
istio_response_bytes
This metric is used to produce the Response Size chart on the metric tabs. And also supports Response Throughput edge labels on the graph
- Appending
|istio_response_bytes_.* to the drop regex above would drop all associated metrics and would prevent any response size/throughput reporting in Kiali.
- Appending
|istio_response_bytes_bucket to the drop regex above would prevent any response size percentile reporting in the Kiali metric charts.
istio_request_duration_milliseconds
This metric is used to produce the Request Duration chart on the metric tabs. It also supports Response Time edge labels on the graph.
- Appending
|istio_request_duration_milliseconds_.* to the drop regex above would drop all associated metrics and would prevent any request duration/response time reporting in Kiali.
- Appending
|istio_request_duration_milliseconds_bucket to the drop regex above would prevent any request duration/response time percentile reporting in the Kiali metric charts or graph edge labels.
Scrape Interval
The Prometheus globalScrapeInterval is an important configuration option. The scrape interval can have a significant effect on metrics collection overhead as it takes effort to pull all of those configured metrics and update the relevant time-series. And although it doesn’t affect time-series cardinality, it does affect storage for the data-points, as well as having impact when computing query results (the more data-points, the more processing and aggregation).
Users should think carefully about their configured scrape interval. Note that the Istio addon for prometheus configures it to 15s. This is great for demos but may be too frequent for production scenarios. The prometheus helm charts set a default of 1m, which is more reasonable for most installations, but may not be the desired frequency for any particular setup.
The recommendation for Kiali is to set the longest interval possible, while still providing a useful granularity. The longer the interval the less data points scraped, thus reducing processing, storage, and computational overhead. But the impact on Kiali should be understood. It is important to realize that request rates (or byte rates, message rates, etc) require a minumum of two data points:
rate = (dp2 - dp1) / timePeriod
That means for Kiali to show anything useful in the graph, or anywhere rates are used (many places), the minimum duration must be >= 2 x globalScrapeInterval. Kiali will eliminate invalid Duration options given the globalScrapeInterval.
Kiali does a lot of aggregation and querying over time periods. As such, the number of data points will affect query performance, especially for larger time periods.
For more information, see the Prometheus documentation.
TSDB retention time
The Prometheus tsdbRetentionTime is an important configuration option. It has a significant effect on metrics storage, as Prometheus will keep each reported data-point for that period of time, performing compaction as needed. The larger the retention time, the larger the required storage. Note also that Kiali queries against large time periods, and very large data-sets, may result in poor performance or timeouts.
The recommendation for Kiali is to set the shortest retention time that meets your needs and/or operational limits. In some cases users may want to offload older data to a secondary store. Kiali will eliminate invalid Duration options given the tsdbRetentionTime.
For more information, see the Prometheus documentation.
3.1 - Jaeger
This page describes how to configure Jaeger for Kiali.
Jaeger configuration
Jaeger is a highly recommended service because Kiali uses distributed
tracing data for several features,
providing an enhanced experience.
By default, Kiali will try to reach Jaeger at the GRPC-enabled URL of the form
http://tracing.<istio_namespace_name>:16685/jaeger, which is the usual case
if you are using the Jaeger Istio
add-on.
If this endpoint is unreachable, Kiali will disable features that use
distributed tracing data.
If your Jaeger instance has a different service name or is installed to a
different namespace, you must manually provide the endpoint where it is
available, like in the following example:
spec:
  external_services:
    tracing:
      # Enabled by default. Kiali will anyway fallback to disabled if
      # Jaeger is unreachable.
      enabled: true
      # Jaeger service name is "tracing" and is in the "telemetry" namespace.
      # Make sure the URL you provide corresponds to the non-GRPC enabled endpoint
      # if you set "use_grpc" to false.
      in_cluster_url: "http://tracing.telemetry:16685/jaeger"
      use_grpc: true
      # Public facing URL of Jaeger
      url: "http://my-jaeger-host/jaeger"
Minimally, you must provide spec.external_services.tracing.in_cluster_url to
enable Kiali features that use distributed tracing data. However, Kiali can
provide contextual links that users can use to jump to the Jaeger console to
inspect tracing data more in depth. For these links to be available you need to
set the spec.external_services.tracing.url to the URL where you
expose Jaeger outside the cluster.
Default values for connecting to Jaeger are based on the
Istio’s provided
sample add-on manifests.
If your Jaeger setup differs significantly from the sample add-ons, make sure
that Istio is also properly configured to push traces to the right URL.
3.2 - Grafana Tempo
This page describes how to configure Grafana Tempo for Kiali.
Grafana Tempo Configuration
There are two possibilities to integrate Kiali with Grafana Tempo:
Using the Grafana Tempo API
There are two steps to set up Kiali and Grafana Tempo:
Set up the Kiali CR
This is a configuration example to set up Kiali tracing with Grafana Tempo:
spec:
  external_services:
    tracing:
      # Enabled by default. Kiali will anyway fallback to disabled if
      # Tempo is unreachable.
      enabled: true
      health_check_url: "https://tempo-instance.grafana.net"
      # Tempo service name is "query-frontend" and is in the "tempo" namespace.
      # Make sure the URL you provide corresponds to the non-GRPC enabled endpoint
      # It does not support grpc yet, so make sure "use_grpc" is set to false.
      in_cluster_url: "http://tempo-tempo-query-frontend.tempo.svc.cluster.local:3200/"
      provider: "tempo"
      tempo_config:
        org_id: "1"
        datasource_uid: "a8d2ef1c-d31c-4de5-a90b-e7bc5252cd00"
      use_grpc: false
      # Public facing URL of Tempo
      url: "https://tempo-tempo-query-frontend-tempo.apps-crc.testing/"
The default UI for Grafana Tempo is Grafana, so we should also set the Grafana URL in the Kiali configuration, such as this example:
spec:
  external_services:
    grafana:
      in_cluster_url: http://grafana.istio-system:3000
      url: https://grafana.apps-crc.testing/
Set up a Tempo Datasource in Grafana
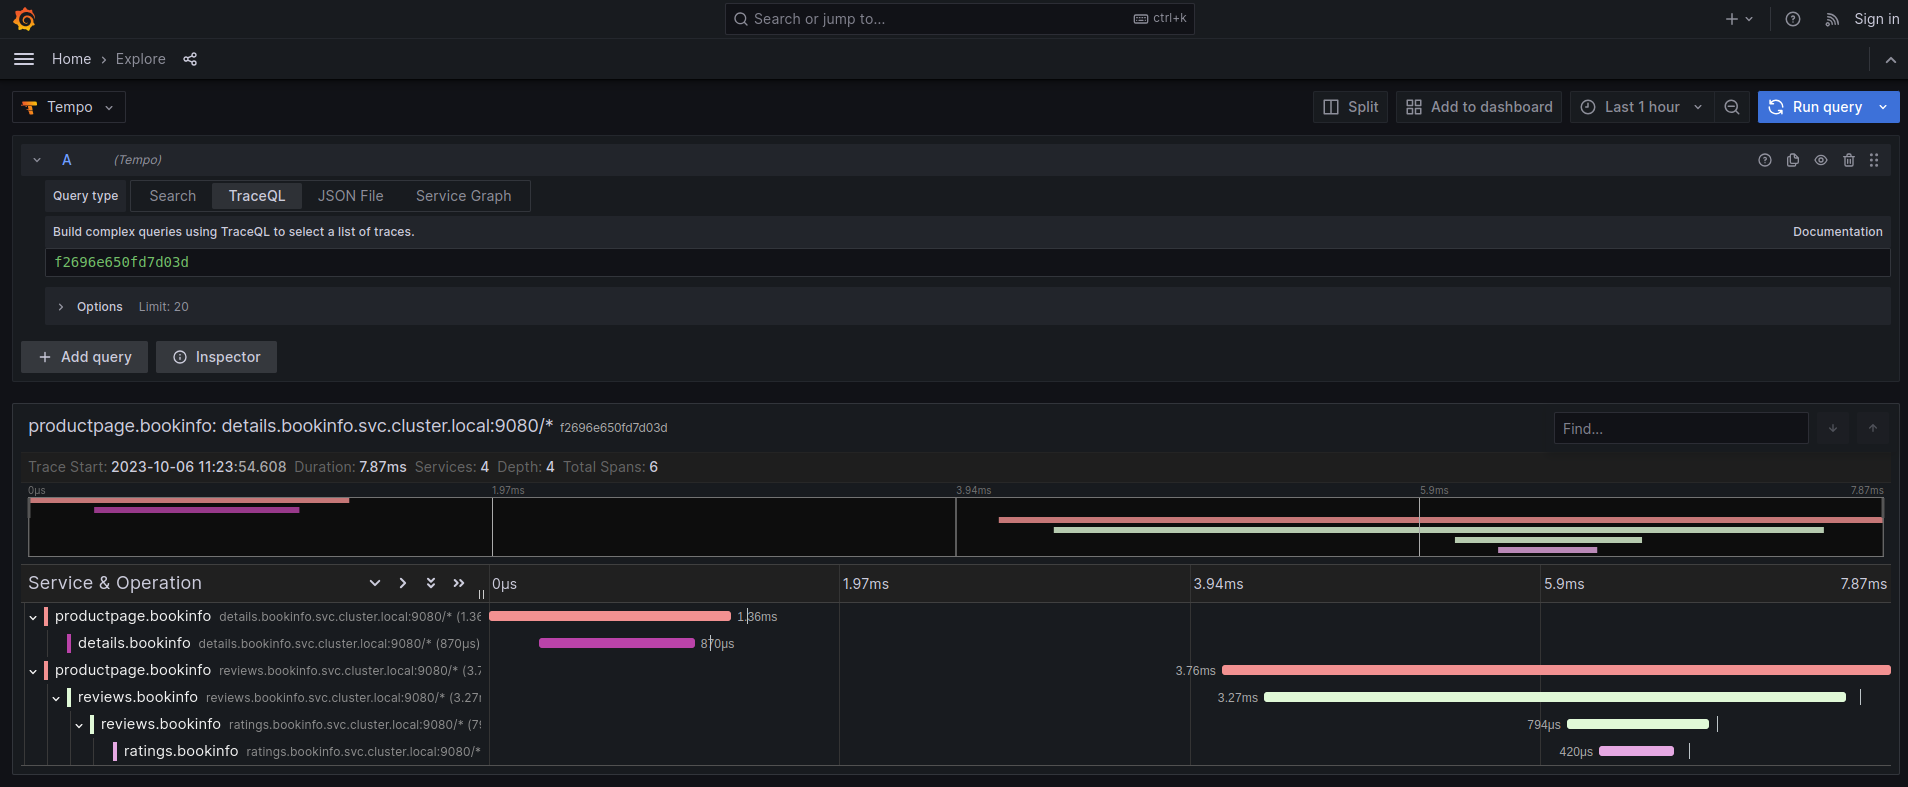
We can optionally set up a default Tempo datasource in Grafana so that you can view the Tempo tracing data within the Grafana UI, as you see here:

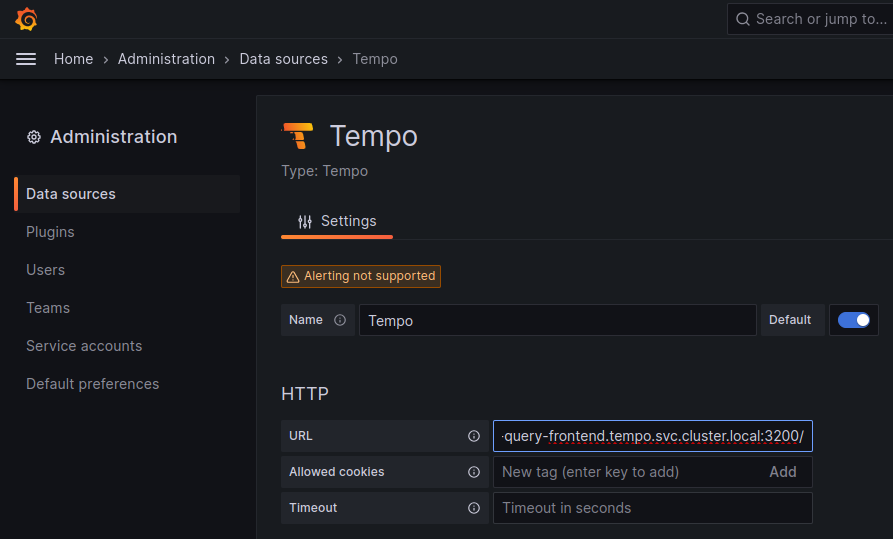
To set up the Tempo datasource, go to the Home menu in the Grafana UI, click Data sources, then click the Add new data source button and select the Tempo data source. You will then be asked to enter some data to configure the new Tempo data source:

The most important values to set up are the following:
- Mark the data source as default, so the URL that Kiali uses will redirect properly to the Tempo data source.
- Update the HTTP URL. This is the internal URL of the HTTP tempo frontend service. e.g.
http://tempo-tempo-query-frontend.tempo.svc.cluster.local:3200/
Additional configuration
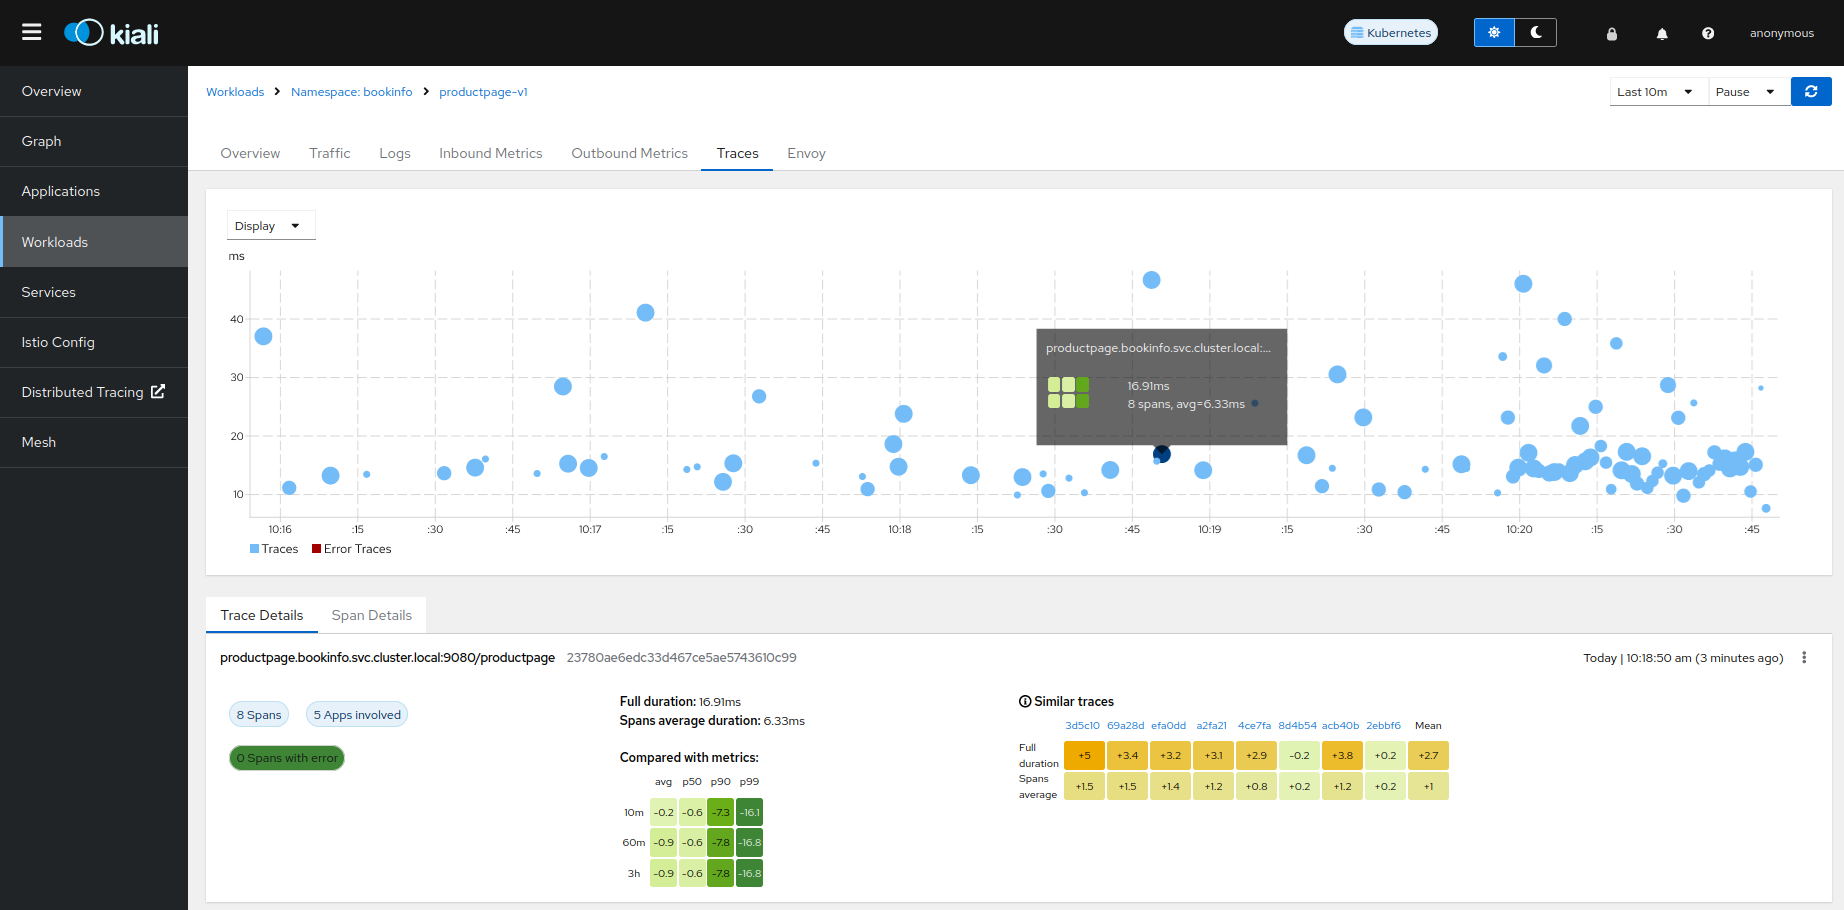
The Traces tab in the Kiali UI will show your traces in a bubble chart:

Increasing performance is achievable by enabling gRPC access, specifically for query searches. However, accessing the HTTP API will still be necessary to gather information about individual traces. This is an example to configure the gRPC access:
spec:
  external_services:
    tracing:
      enabled: true
      # grpc port defaults to 9095
      grpc_port: 9095
      in_cluster_url: "http://query-frontend.tempo:3200"
      provider: "tempo"
      use_grpc: true
      url: "http://my-tempo-host:3200"
Service check URL
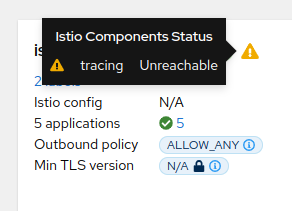
By default, Kiali will check the service health in the endpoint /status/services, but sometimes, this is exposed in a different url, which can lead to a component unreachable message:

This can be changed with the health_check_url configuration option.
spec:
  external_services:
    tracing:
      health_check_url: "http://query-frontend.tempo:3200"
Configuration for the Grafana Tempo Datasource
In order to correctly redirect Kiali to the right Grafana Tempo Datasource, there are a couple of configuration options to update:
spec:
  external_services:
    tracing:
      tempo_config:
        org_id: "1"
        datasource_uid: "a8d2ef1c-d31c-4de5-a90b-e7bc5252cd00"
org_id is usually not needed since “1” is the default value which is also Tempo’s default org id.
The datasource_uid needs to be updated in order to redirect to the right datasource in Grafana versions 10 or higher.
Using the Jaeger frontend with Grafana Tempo tracing backend
It is possible to use the Grafana Tempo tracing backend exposing the Jaeger API.
tempo-query is a
Jaeger storage plugin. It accepts the full Jaeger query API and translates these
requests into Tempo queries.
Since Tempo is not yet part of the built-in addons that are part of Istio, you
need to manage your Tempo instance.
Tanka
The official Grafana Tempo documentation
explains how to deploy a Tempo instance using Tanka. You
will need to tweak the settings from the default Tanka configuration to:
- Expose the Zipkin collector
- Expose the GRPC Jaeger Query port
When the Tempo instance is deployed with the needed configurations, you have to
set
meshConfig.defaultConfig.tracing.zipkin.address
from Istio to the Tempo Distributor service and the Zipkin port. Tanka will deploy
the service in distributor.tempo.svc.cluster.local:9411.
The external_services.tracing.in_cluster_url Kiali option needs to be set to:
http://query-frontend.tempo.svc.cluster.local:16685.
Tempo Operator
The Tempo Operator for Kubernetes
provides a native Kubernetes solution to deploy Tempo easily in your system.
After installing the Tempo Operator in your cluster, you can create a new
Tempo instance with the following CR:
kubectl create namespace tempo
kubectl apply -n tempo -f - <<EOF
apiVersion: tempo.grafana.com/v1alpha1
kind: TempoStack
metadata:
  name: smm
spec:
  storageSize: 1Gi
  storage:
    secret:
      type: s3
      name: object-storage
  template:
    queryFrontend:
      component:
        resources:
          limits:
            cpu: "2"
            memory: 2Gi
      jaegerQuery:
        enabled: true
        ingress:
          type: ingress
EOF
Note the name of the bucket where the traces will be stored in our example is
called object-storage. Check the
Tempo Operator
documentation to know more about what storages are supported and how to create
the secret properly to provide it to your Tempo instance.
Now, you are ready to configure the
meshConfig.defaultConfig.tracing.zipkin.address
field in your Istio installation. It needs to be set to the 9411 port of the
Tempo Distributor service. For the previous example, this value will be
tempo-smm-distributor.tempo.svc.cluster.local:9411.
Now, you need to configure the in_cluster_url setting from Kiali to access
the Jaeger API. You can point to the 16685 port to use GRPC or 16686 if not.
For the given example, the value would be
http://tempo-ssm-query-frontend.tempo.svc.cluster.local:16685.
There is a related tutorial with detailed instructions to setup Kiali and Grafana Tempo with the Operator.
Configuration table
Supported versions
Kiali Version |
Jaeger |
Tempo |
Tempo with JaegerQuery |
| <= 1.79 (OSSM 2.5) |
✅ |
❌ |
✅ |
| > 1.79 |
✅ |
✅ |
✅ |
Minimal configuration for Kiali <= 1.79
In external_services.tracing
|
http
|
grpc
|
| Jaeger |
.in_cluster_url = 'http://jaeger_service_url:16686/jaeger'
.use_grpc = false
|
.in_cluster_url = 'http://jaeger_service_url:16685/jaeger'
.use_grpc = true (Not required: by default)
|
| Tempo |
.in_cluster_url = 'http://query_frontend_url:16686'
.use_grpc = false
|
.in_cluster_url = 'http://query_frontend_url:16685'
.use_grpc = true (Not required: by default)
|
Minimal configuration for Kiali > 1.79
|
http
|
grpc
|
| Jaeger |
.in_cluster_url = 'http://jaeger_service_url:16686/jaeger'
.use_grpc = false
|
.in_cluster_url = 'http://jaeger_service_url:16685/jaeger'
.use_grpc = true (Not required: by default)
|
| Tempo |
in_cluster_url = 'http://query_frontend_url:3200'
.use_grpc = false
.provider = 'tempo'
|
.in_cluster_url = 'http://query_frontend_url:3200'
.grpc_port: 9095
.provider: 'tempo'
.use_grpc = true (Not required: by default)
|
